
After shopping for a few months, I realized that I should likely keep track of my batches. While the Instacart Shopper app does a good job at providing me with basic information, there was so much more that I wanted to know.
- What was my effective earnings per hour?
- Were some stores better than others?
- How much of my income is from tips?
- How often did my tips go up or down?
- Are double and triple batches worth the extra aggravation?
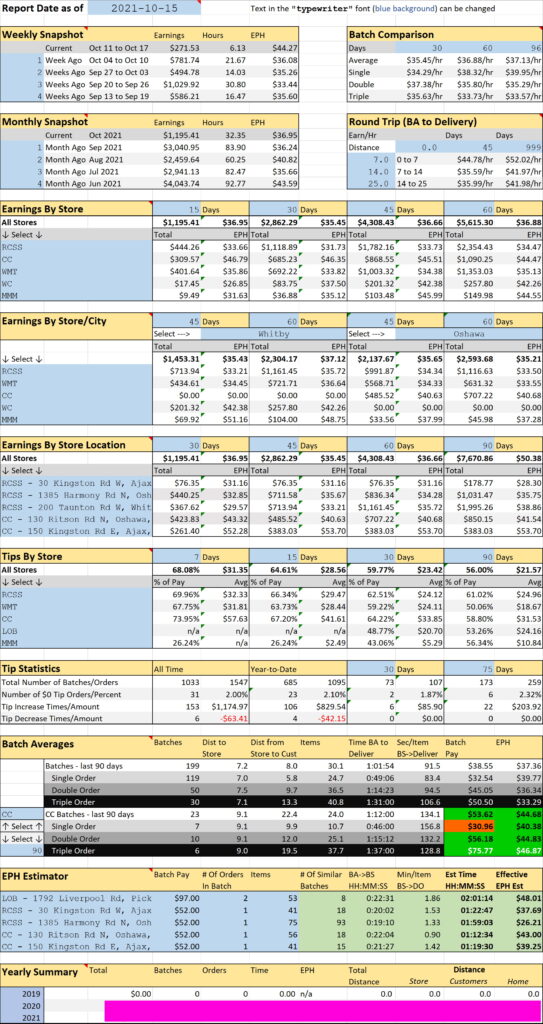
In order to find out I started creating an Excel spreadsheet. Aside from tracking my earnings, it helped me to figure out what batches were better for me . . . and I founds the answers to the above and soooo much more!
- For example, I learned that batches where the customer(s) were 7km (about 4.5mi) or less from the store earned me about $11 more per hour than those where customer(s) were 14km (about 9mi) away.
- Costco orders earned me 25% more than regular grocery orders
- Costco customer were the most generous tippers
- 15% of my orders had deliberate tip increase adjustment by the customer
- About 0.5% of my orders had a deliberate tip decrease adjustment by the customer
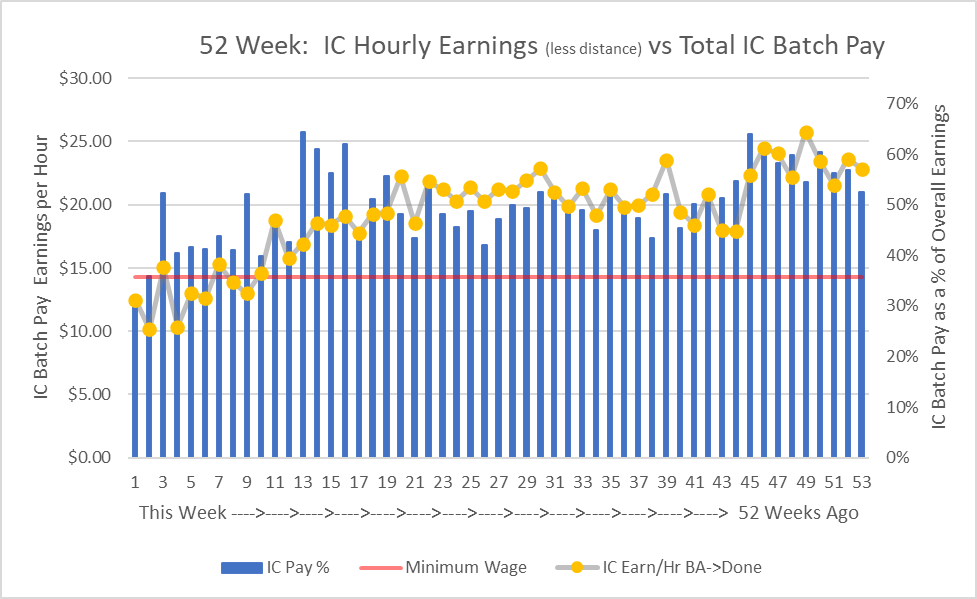
To make things even more effective for me I created a dashboard so I could see the information at a glance and choose different reporting time frames. After a while I even created graphs to show some of the data. While all the was good, it did spend about 1-2 minutes per batch entering the necessary data.
This data has proven to be extremely useful but also a very powerful tool. A lot of the data and custom reports were provided to CBC in their video and written online story about Instacart. Having documented data and analytics allow CBC to substantiate claims that I and other Shoppers were making about Instacart slashing our earnings.
It would be great if all Shoppers could track their earnings is some way, but that’s an individual choice. Even though the earnings are documented in the app, it doesn’t provide any additional or useful information. In addition, I regularly see Instacart removing more and more information that they don’t want us to have.
Knowledge and information equal power. Shoppers can have more power and control with more knowledge. I want to arm Shoppers allowing them to better utilize their own information. I’m currently making some changes and simplifying the spreadsheet making it easier for Shoppers to track earnings. If you’re interested in getting a copy (I’m giving this away), contact me with your request!